Taking Temperatures

insulation mitts
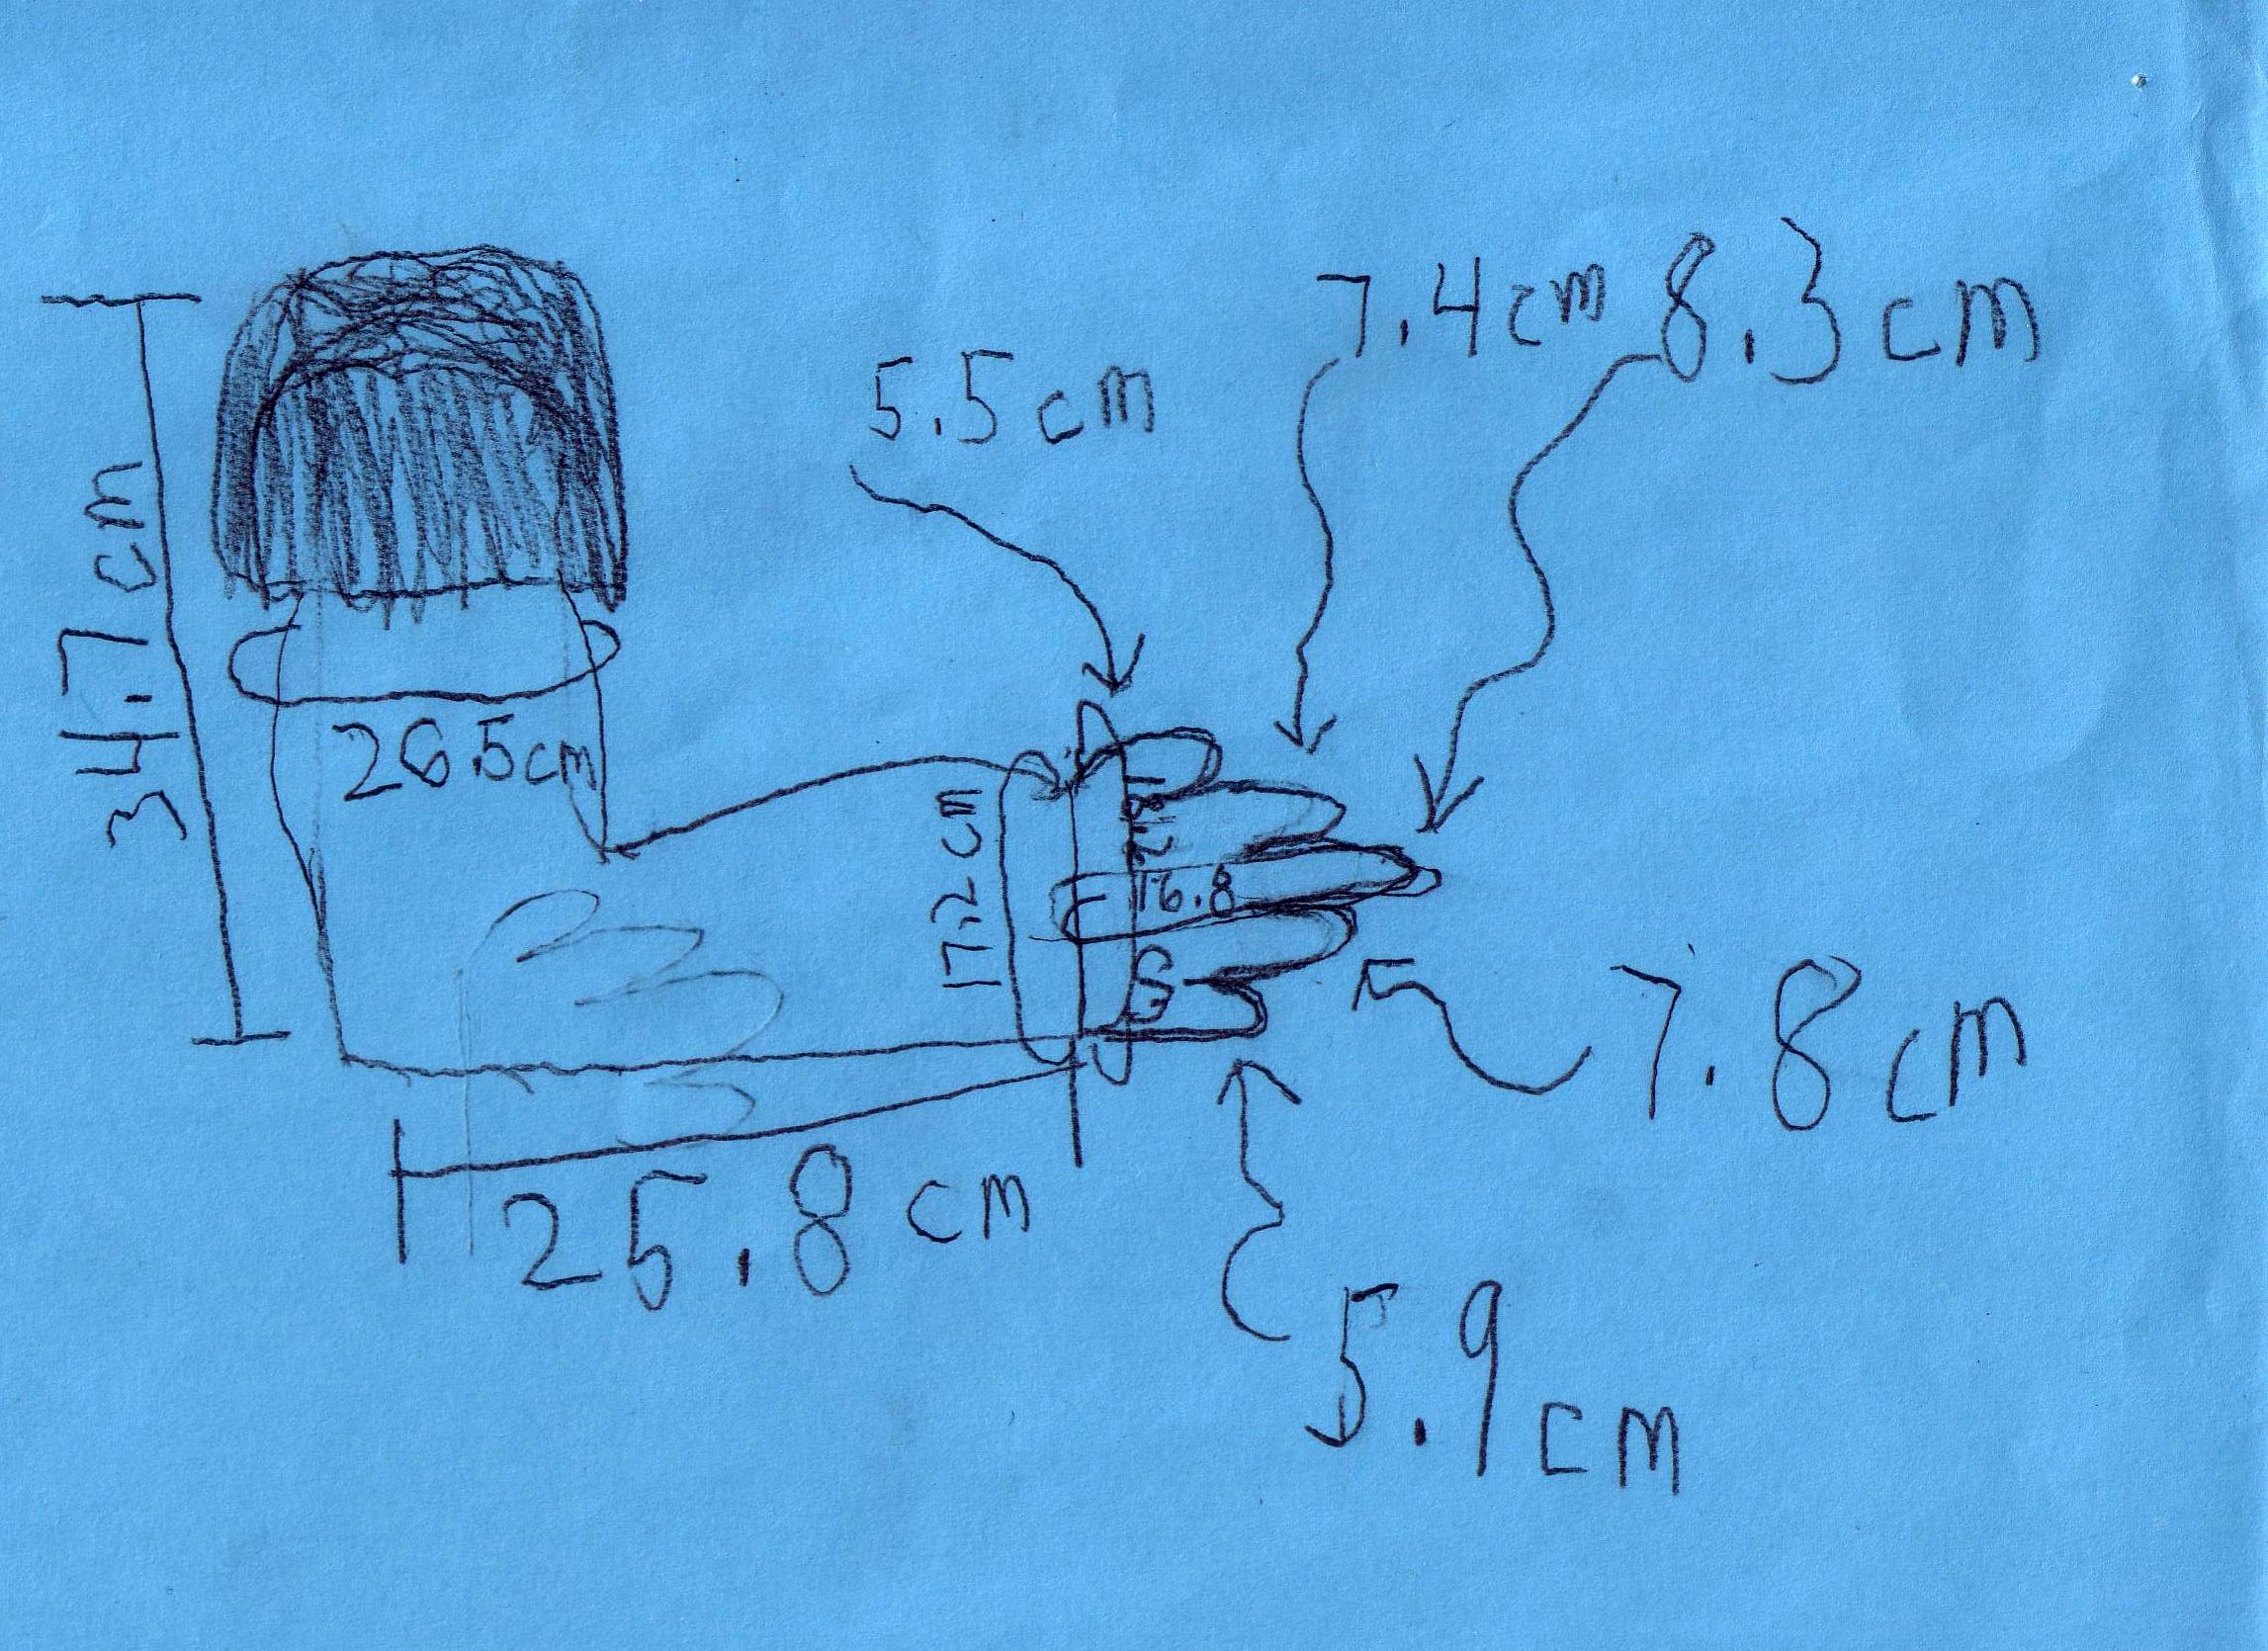
Someone, in a long proud parade of projects time parent volunteers, knew she would be doing temperature experiments with her small group, and arrived carrying these perfectly designed mitts.

(If you know where the credit should be assigned, please comment!)

using temperature mitts edit
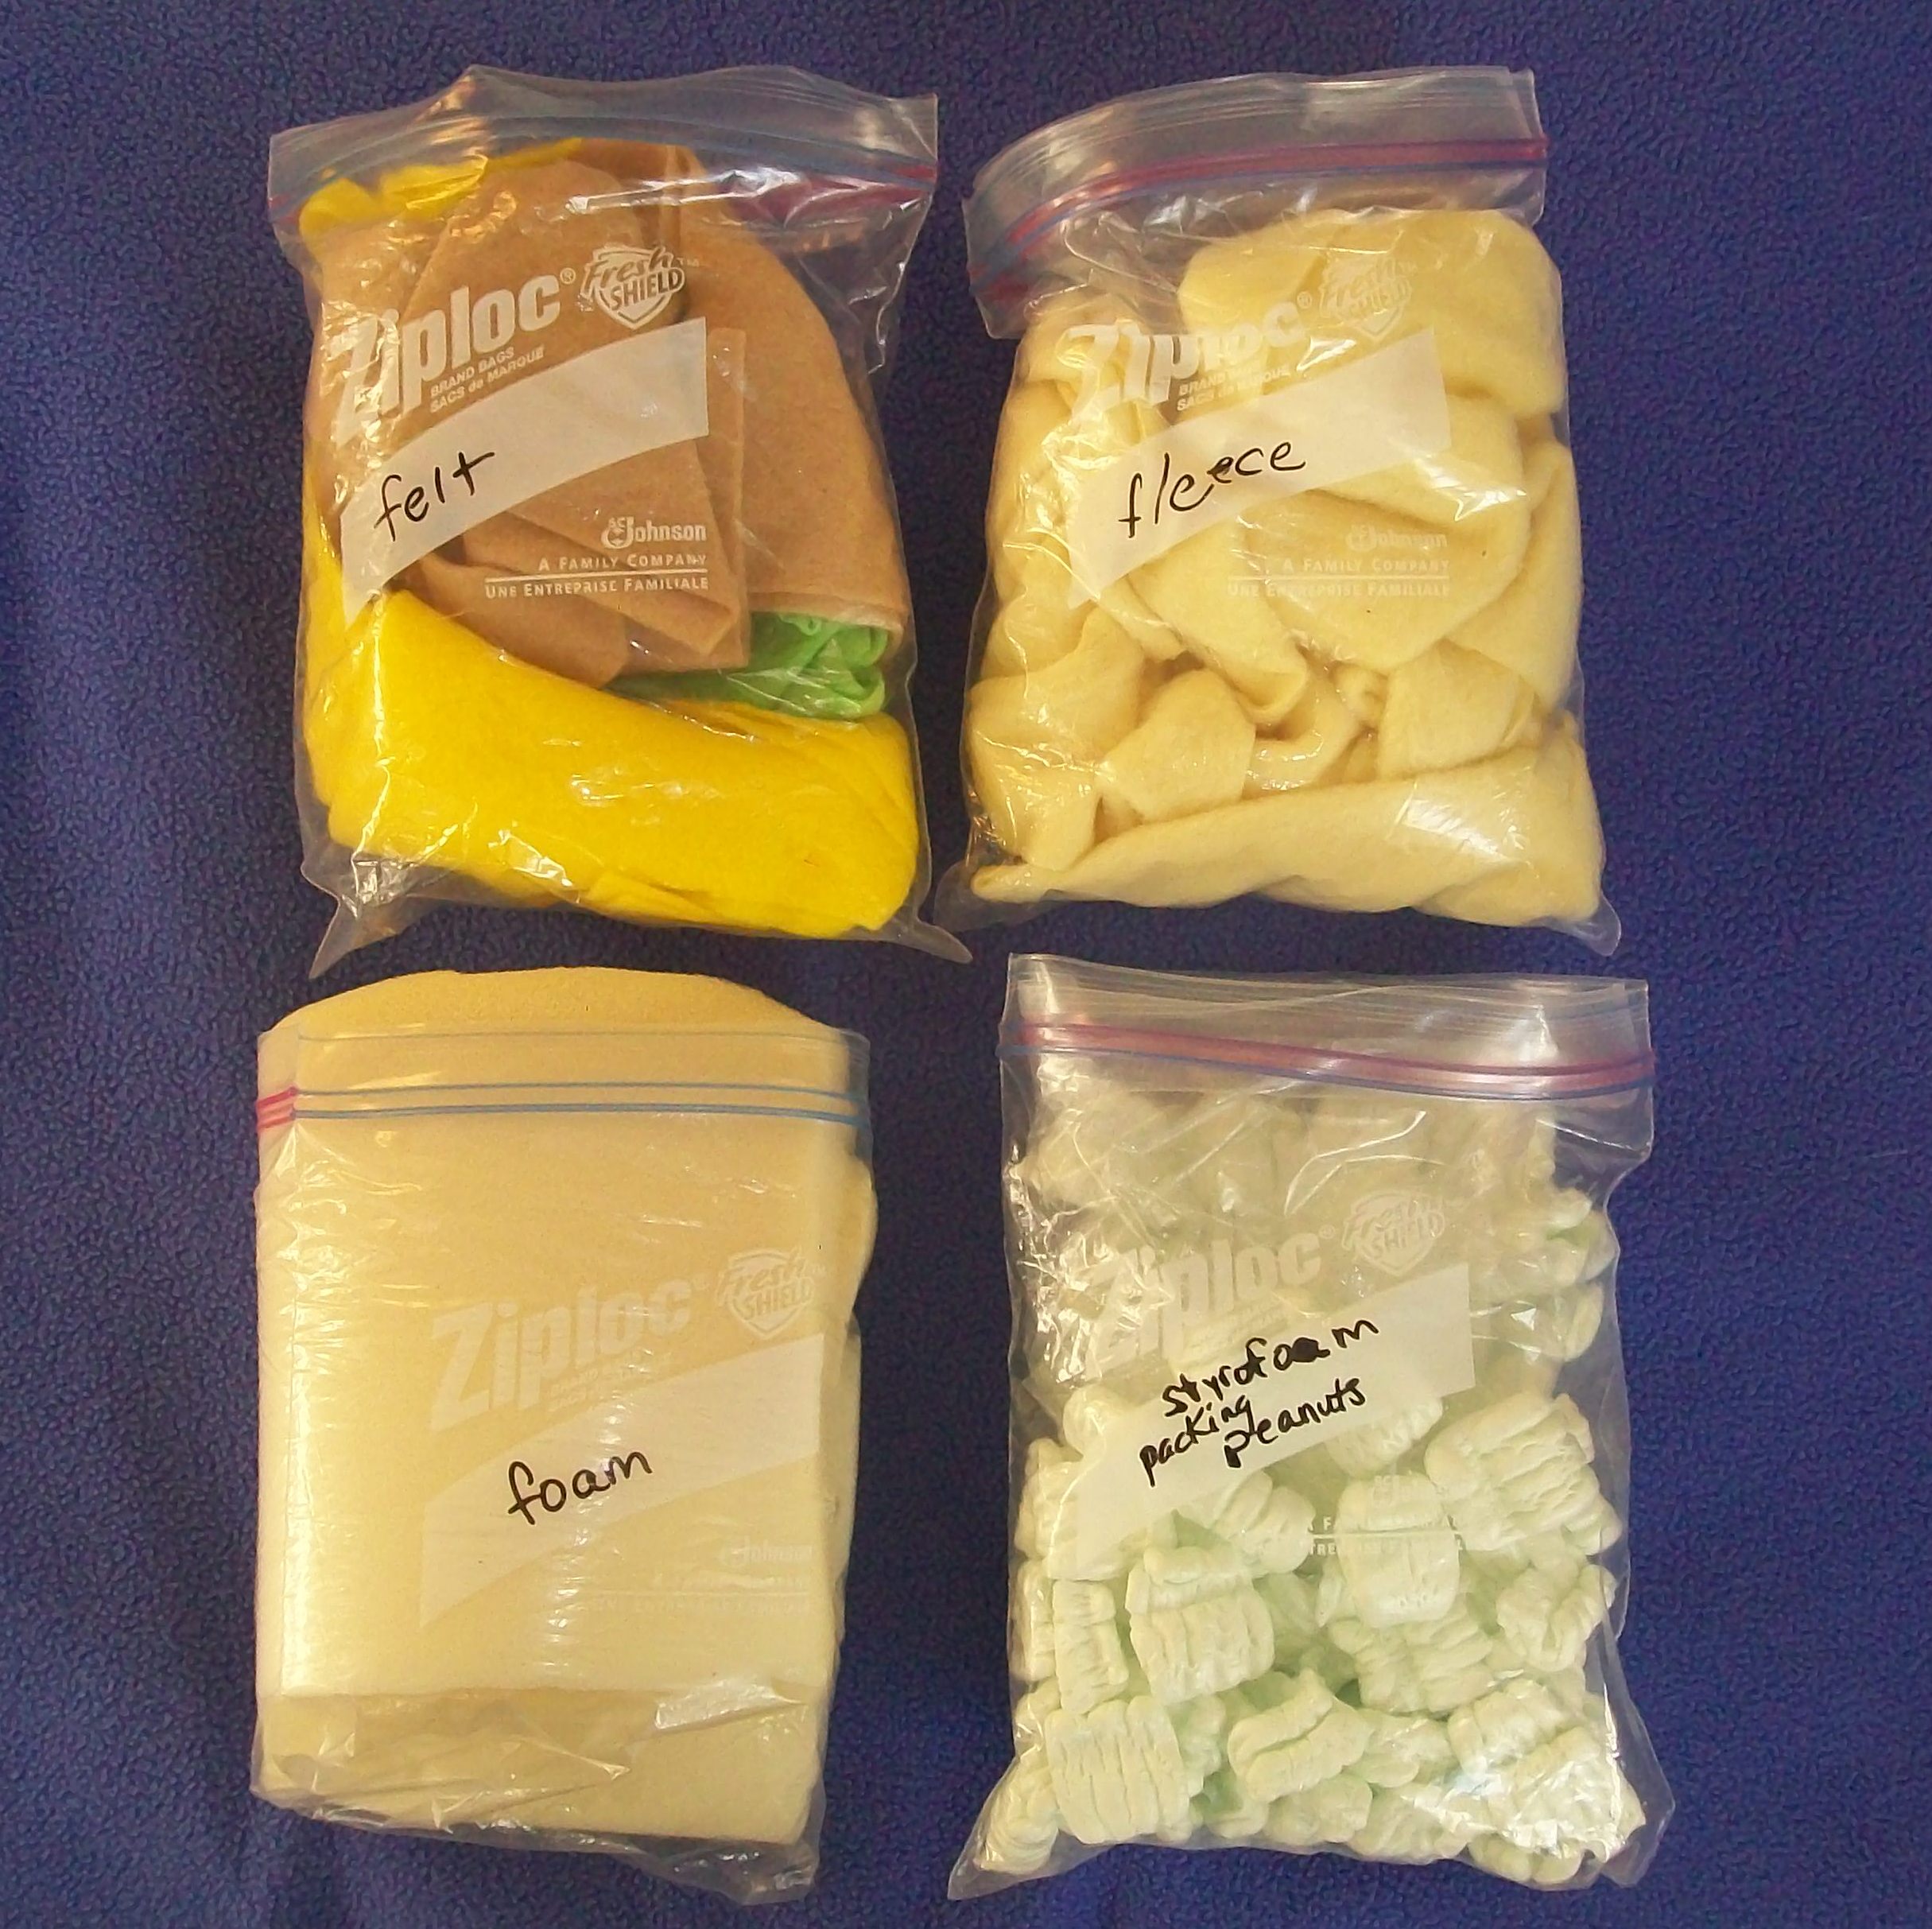
The mitts are made of plastic baggies, filled with puffy stuff for insulation. For the plastic peanuts and the fleece, there are two bags, one inside another, flipped edge to edge so they could zip together and contain, between them, a consistent depth of insulation.

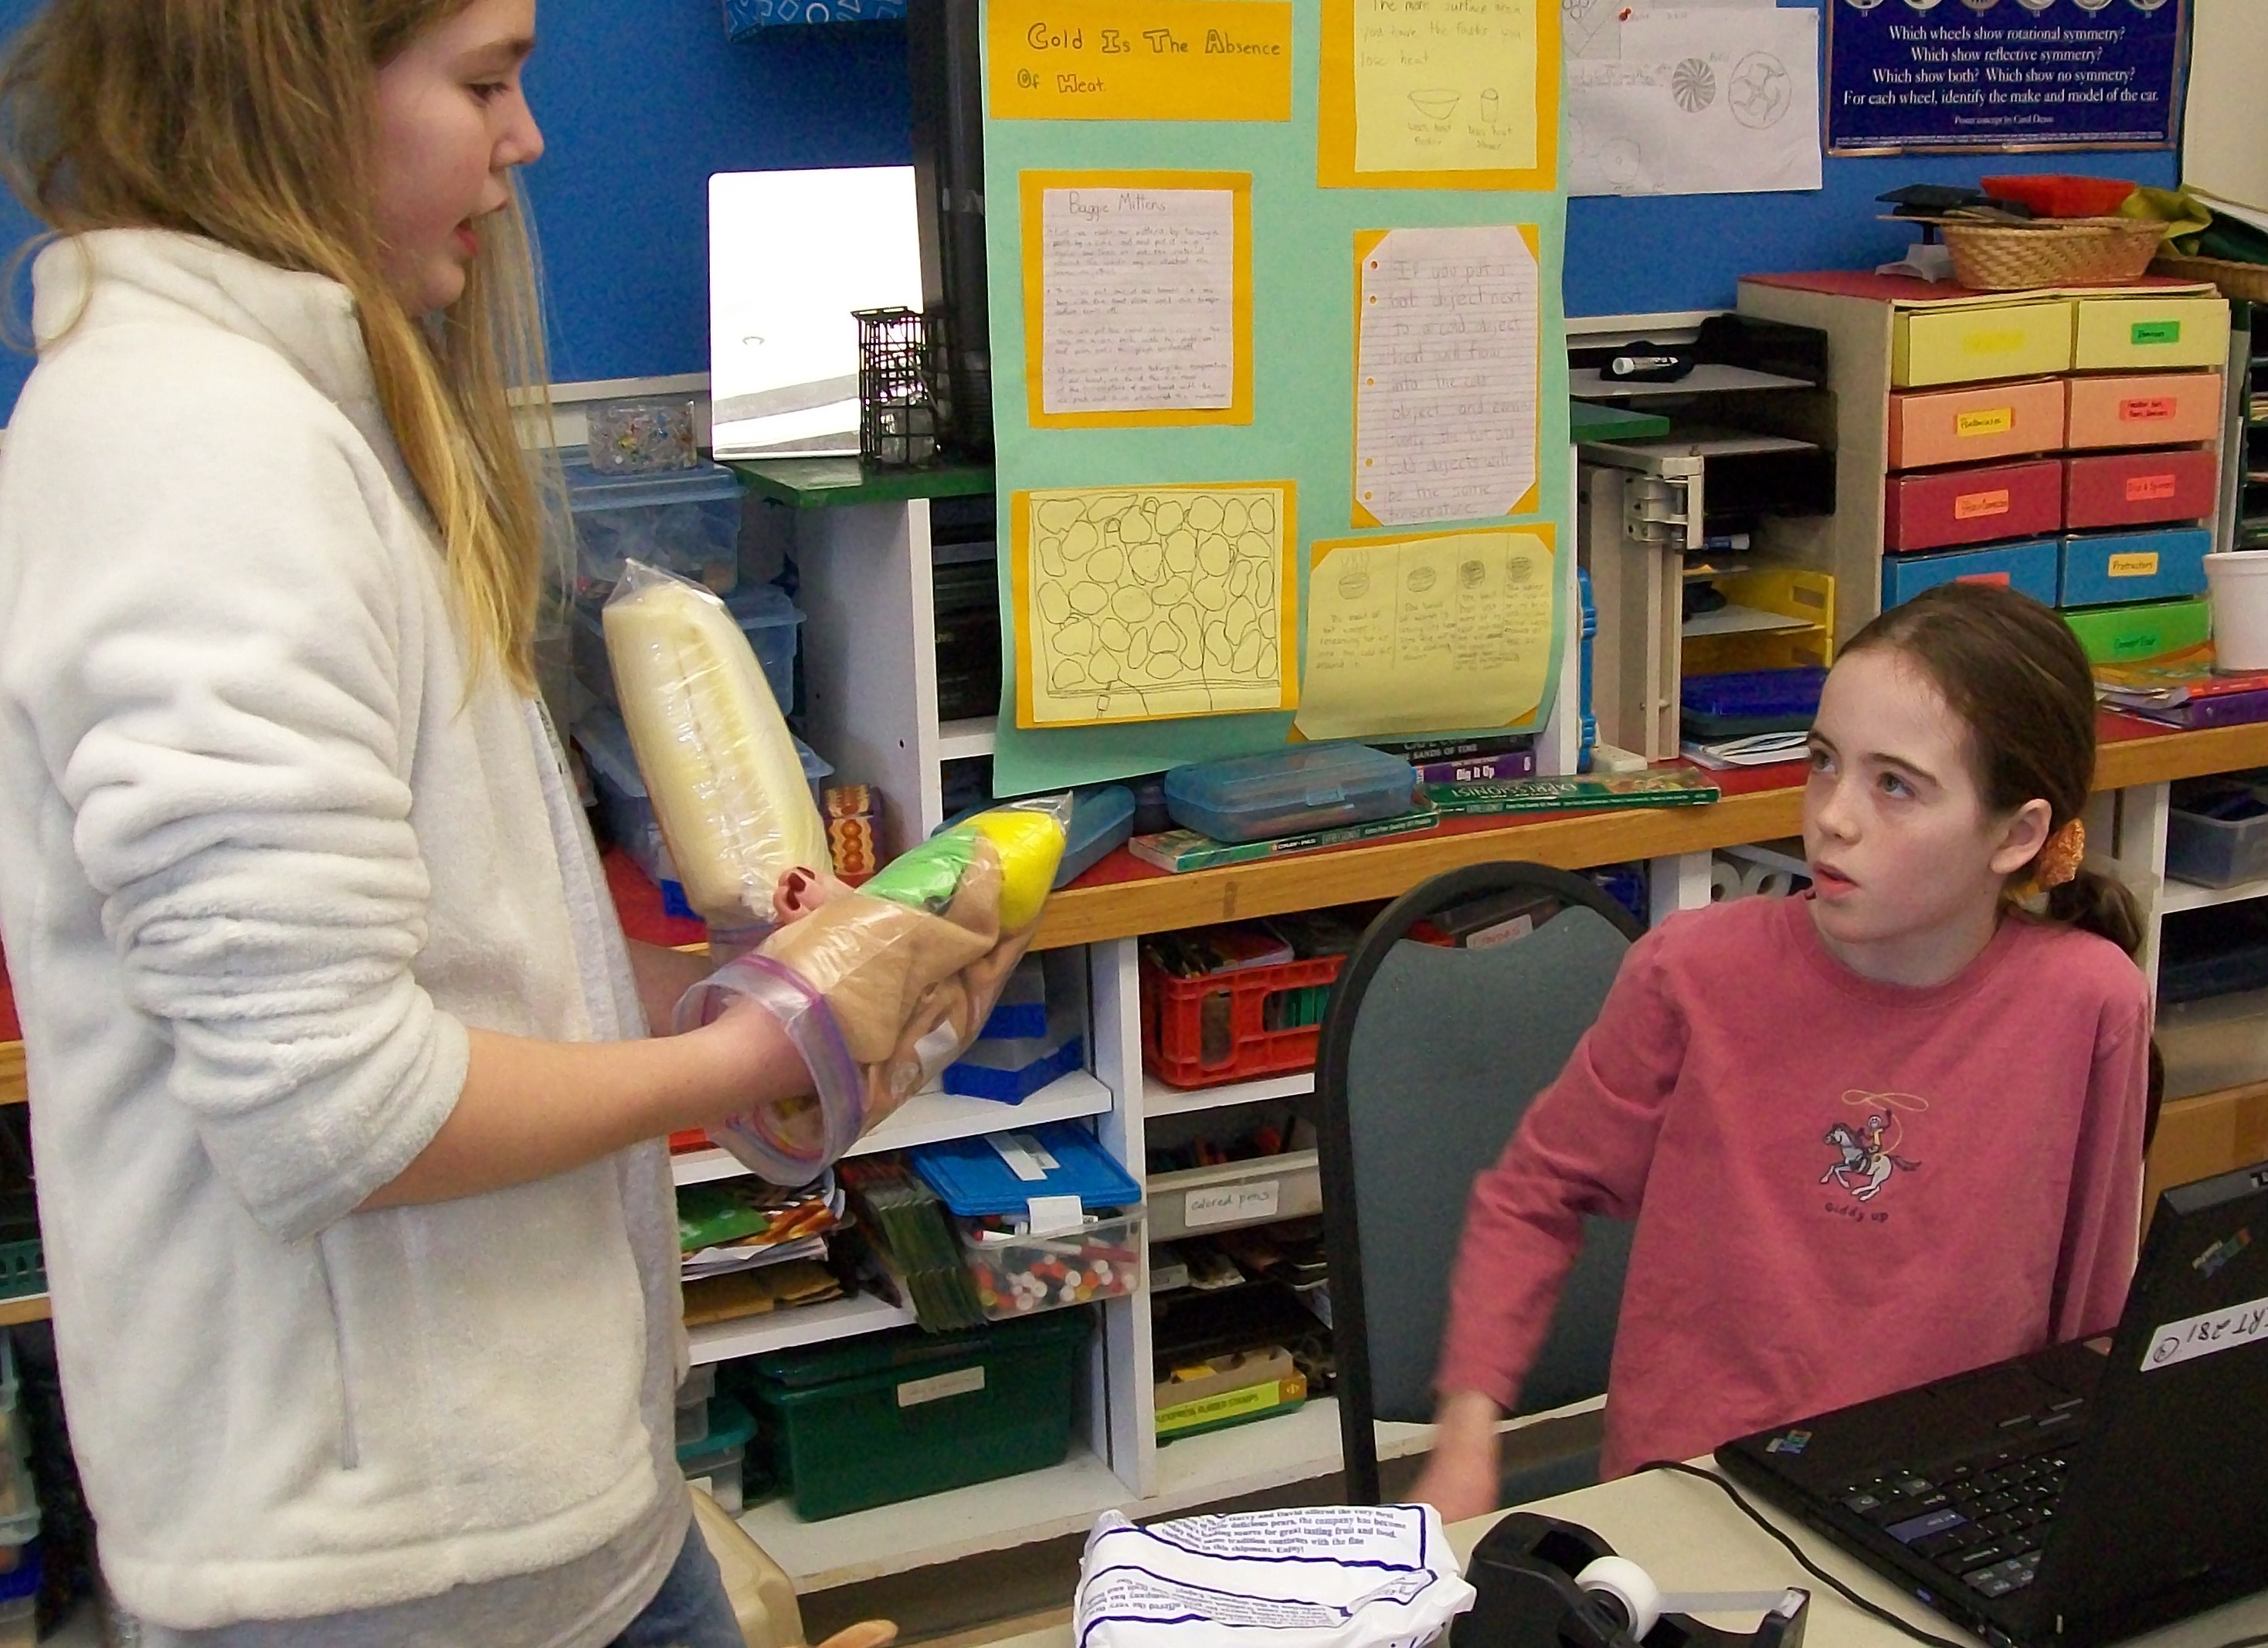
Into the baggies, kids inserted a Vernier temperature probe, a specially designed thermometer with a line to attach it to a computer interface. Measuring the temperatures of small buckets of ice or heated water, they examined the data on real-time graphs, which were created by Vernier software on the computer. Students could see the curve as the temperature rose or fell. The mitts let them compare the effectiveness of various kinds of insulation.

Without a live demonstration of the use of real-time graphing using probes of this sort, I find it difficult to convey the dramatic POW! of the experience. The whole activity of graphing suddenly makes more sense. Kids see clearly the relationship between the x axis (usually time) and the y axis (measurements of temperature, light, force, gas pressure, sound, proximity…or any of a number of attributes for which probes have been designed.)

Here’s a graph of a very simple trial, in which a student held the temperature probe directly in her hand. The graph rises gradually to a peak, then falls off quickly—but not instantly—when the person’s hand is removed.

heat graph

Sometimes we compared: which hand was warmer, right or left? Did that correlate with the person’s handedness in any way? Could we be sure of the correlation, or were there too many other variables, not controlled?

(In many programs, it’s possible to graph several trials on the same screen, using different colors. For example, we could graph the data from the right hand in red and the data from the left hand in green, or graph multiple trials for each hand in assigned colors. The software also provides a full table of the data, and instant statistics including the range and the mean.)

We did experiments of this sort before we had computer probes, of course, just using regular thermometers. In the very earliest years of using The Voyage of the Mimi, thinking about whales and the insulating effect of blubber, we found ways to test the effectiveness of insulation, and these mitts would have been perfect.

More recently, working with the occasional use of a small classroom set of iPads, we used a Vernier temperature probe along with a interface called a LabQuest2, to let us gather and graph temperatures outside, streaming the graphs, as they were drawn, on multiple iPads.

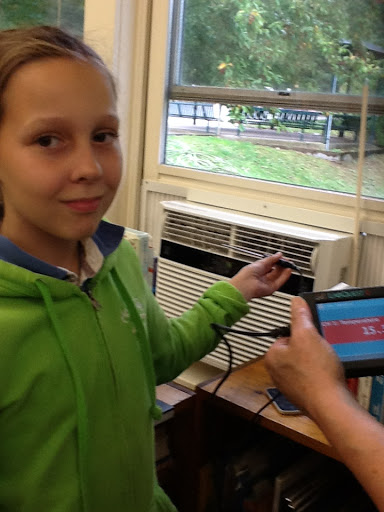
Here’s a group who’ve come inside to debrief. (You can see the temperature probe in Abi’s hand.) They were playing a game called Microclimate Tic-tac-toe, and looking at the tic-tac-toe grid on the small whiteboard in Patty’s hand, to review what they’d found. For now, it’s enough to say that they were searching for microclimates: localized, specialized conditions of temperature, light, and moisture.

microclimate group with Patty

ipad temp workThis group has found very hot temperatures on a large black tire on the playground. They can feel the high temps even with their fingers.

Another student uses a second iPad to watch the graph  as it’s drawn from the probe data.

temp work damp soil

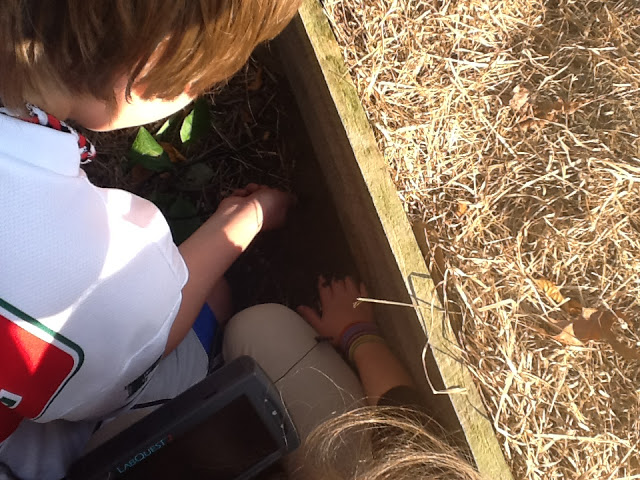
Meanwhile, there’s a much cooler place nearby, in the shadowed, moist soil next to the tire.

The very compact LabQuest2 device is just visible in the lower left corner of the photo. It communicates with the iPads using one of the school’s WiFi networks.

fall projects Morgan

Here are members of another group working inside, finding the coolest and warmest temperatures they could locate in the classroom.

John reaching edited

What did we want the kids to get from all this data collection? We wanted students to join the admirable horde of humans who’ve started out understanding the world by figuring out how to measure it. We wanted students to feel comfortable describing the world in quantitative terms, in numbers with a unit of measurement attached.

In this case, measuring temperature, we wanted students to become flexible about using either Fahrenheit or Celsius, and we wanted them to operate at an intersection between data collected with appropriate measurement tools, and the testimony of their own senses, so that the numbers acquired sensory meaning.

I’m working on this post on a perfect day for searching for microclimates outside: a chilly wind, bright sun. In conditions like these, kids could easily find temperatures varying by as much as 20 degrees Fahrenheit, often within a few feet of each other.

And if students were hungry for something really dramatic, we’d send them off to check the hood of a black car in the parking lot. They might never look at a black car on a sunny day in quite the same way again.

Building Average

I’m here to confess: I’ve spent a good portion of my teaching career guiding students in freaking out the cleaning staff.

Each year, in Level 6 math, we built a model of the Average Student, statistically accurate, earnestly assembled, vaguely lifelike. We set it up in a chair toward the back of the room. Usually the students chose a book to balance on its lap. I myself sometimes entered the room, at the end of a long meeting after school, and did a double take.

Traditionally, we took a group photo of the assembled class, with the dummy. Here, for example, is an unusually small class, from the fall of 2010. (Clockwise from the top, Kelly, Ben, Seth, Anna, Lydia, and Gianna,)

average 2010 better

A few weeks post-portrait, when stray arms or eyebrows began to fall off and litter the classroom floor, we held a funeral, usually with dual caskets–since one cardboard box couldn’t hold it all. We paraded more-or-less solemnly to the dumpster, and gave heartfelt testimonials about everything Average had helped us learn–

–which was a lot. If you ask a typical adult what an average is, chances are you’ll get the series of steps followed to find the mean of a set of numbers: add up all the numbers; then divide by the number of numbers.

That’s not wrong, as directions. But what does an average really mean? What can it tell you about a situation or a set of data? What can it not tell?

MathLand­—a wonderful math curriculum no longer in print—gave Level 6 students a chance to explore the idea of ‟average” from the inside. Many years after we had shifted to another curriculum, I kept starting the year with this unit, because it was perfect from so many points of view.

Setting a goal

You could build an average kitten, or an average bookbag–but it worked really well to build an average math class student. Kids took it all more personally, and paid more attention to interesting questions: Is Average identical to any individual in the group? How does the model represent each person’s data?

MathLand provided a data sheet which included a variety of measurable attributes—such as the girth of the neck, or the length of the upper leg from the hip to the knee. The sheet also asked about attributes that had to be described in other ways—such as the color of eyes or hair.

Some questions were yes or no: Do you wear a watch most days? Some questions had been wisely left out. Average was always just Average, neither he nor she. We weren’t asked to measure around the waist, or chest, just shoulder to shoulder.

Some questions deliberately provoked discussion. How do you measure the length of the neck? From the bottom of the ear? From the hairline? The whole class had to stop and decide, together, or the data would be meaningless.

Gathering and recording data

Before we could begin collecting data, we had to choose an appropriate unit of measurement, and an appropriate degree of precision. I did specify metric units, partly because I wanted students to get some practice with decimal numbers. The kids agreed that the measurements had to be at least as precise as the nearest centimeter. Even that could result in very unrealistic hands, though; so we almost always wound up agreeing it should be to the nearest millimeter, which we recorded as a tenth of a centimeter. (Fertile fields, of course, all of this.)

Boys helped boys measure, and girls helped girls. All the data was kept anonymous—and we said that the study subjects were unreachable for clarification of messy handwriting, so the recorded data had to be both readable and reliable.

Working with data

On the other hand, the occasional inscrutable handwriting also offered a relevant opportunity, once we reached the computation stage: If you can only read the data for 11 of the 12 members of the group, what should you use to divide the total? What would happen to the mean if you divided by 12 instead of 11?

Also, once you got your mean, would it tell you anything about the huge variation in sizes of kids this age? No–only if you added information about the range, which wouldn’t actually get built into our model.

Could a very long-legged class member and a very short-legged class member cancel each other out? Yes, in effect. But in a class with several unusually long-legged people, would the mean probably be affected? Yes, again.

Meanwhile, what about the attributes described by words? For those, we found the mode, the most common answer or value, with interesting results. A math class with only 4 out of 13 blue-eyed students could wind up building a blue-eyed Average, if the rest of the kids were divided evenly among brown, green, and hazel. ‟So my brown eyes have disappeared from our Average representation?” a certain kind of kid would ask, even without being paid or prompted.

Representing data:

Ed's arm blueprint croppedAlthough they were working together, every child measured, and recorded measurements. Every child took part in finding the mean or mode for the attributes of his or her team’s assigned body part. Finally, every child drew a “blueprint.” Here’s Ed Pascoe’s blueprint for the arm and fingers.

Julia's face blueprintEach person on the team assigned to manufacture the head and facial features, for example, started out by making a basic sketch of a face, and then labeled the mouth with the mean width of the mouth, the eyes with the color of the mode for eyes, and so on. Here’s Julia Bertolet’s blueprint for the head.

Then, following the suggestion of the curriculum, but apparently against common practice in most places using MathLand, we actually built our model. We were armed:

  • with blueprints, measuring tapes and invaluable partners, for quality control;
  • with brown grocery bags for skin, crumpled newspaper for insides, Sculpey for ears and nose, and miles of masking tape to hold it all together;
  • with paper fasteners for knee and elbow joints and a meter stick taped to the back of the chair to make this character a vertebrate, able to sit up proudly;
  • with the almost invariable blue jeans and t-shirt that fulfilled those modal mandates;
  • and with endless jokes. “Where did you put our torso now?” Etc.

Being mathematicians

All this took time, it’s true. Gobs of time, all of it worthwhile. As teacher, I could observe difficulties with measuring technique, awkwardness with calculators, challenges maintaining focus even with the physical reminder of the unfinished body part. I could identify unusual ability to ask the salient questions, or to solve construction problems, or unusual gracefulness in helping a partner stay on task. The kids could figure out what to expect from, and give to, each other. I could cheer on strengths, provide the necessary re-teaching or skill-building support, and encourage insight—and kids could do all that for each other—within an atmosphere of fun.

We were having fun. We were also thinking about questions central to so many math applications: questions about reliability of data; questions about precision; and questions about whether a calculated answer fits an intuited estimate, given the range of the data. We were doing what many adult users of mathematics do: using that language to explore the world.

And of course, we were united, and found truly memorable group satisfaction, in making life more interesting for the cleaning staff. Or anyone else who wandered by.

average 2010 goofy